Atliq Technologies
Atliq Technologies is a computer hardware and peripheral company in India. They are based in the Northen region of India, with stores throughout India. This was a personal project using real data from a real company that shared its data to learn from.
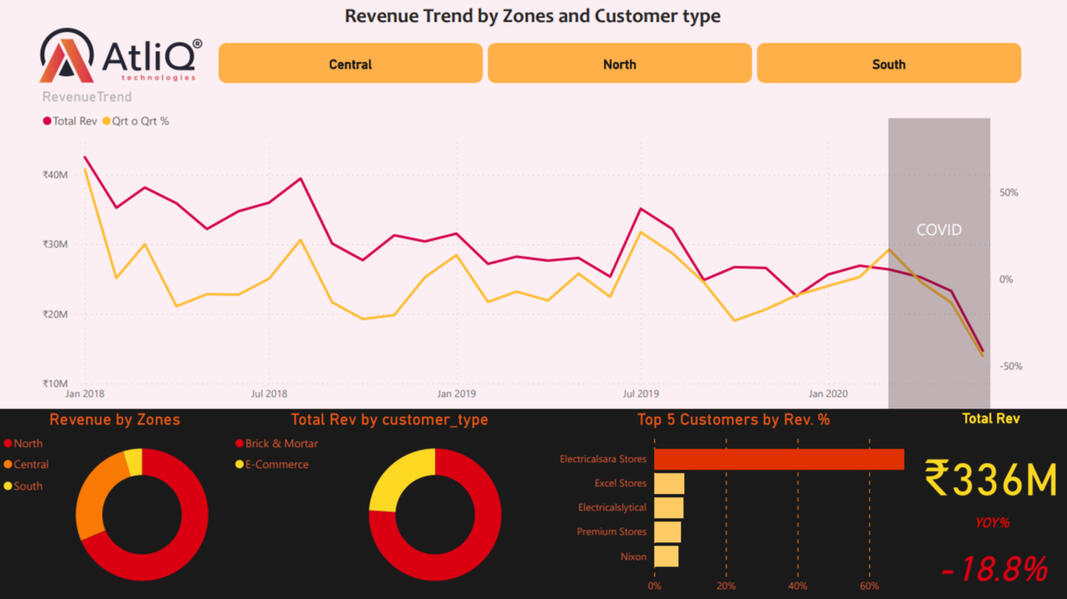
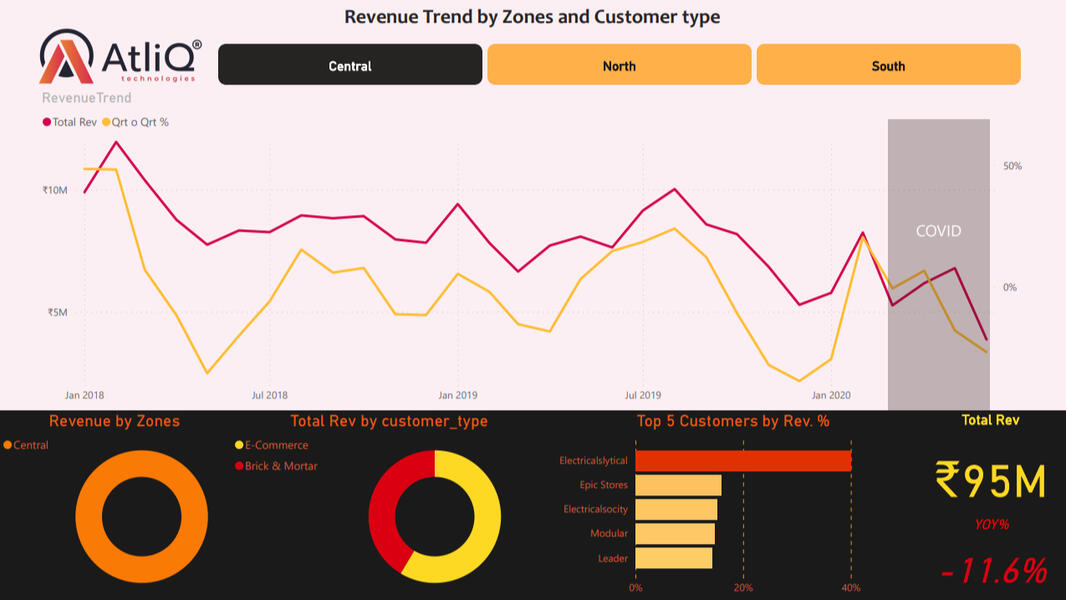
There is an overall trend down in revenue since 2018, with a total Revenue of ₹336 Million (Indian Rupees) to date. The North region makes up over 68% of the total revenue, and 75% of that is from Electricalsara Stores.
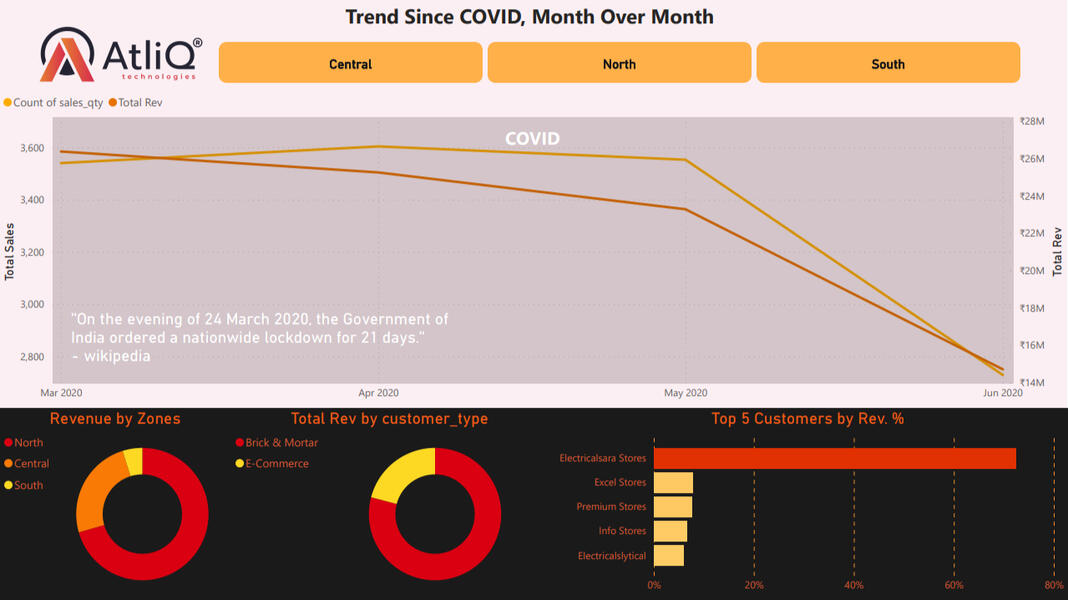
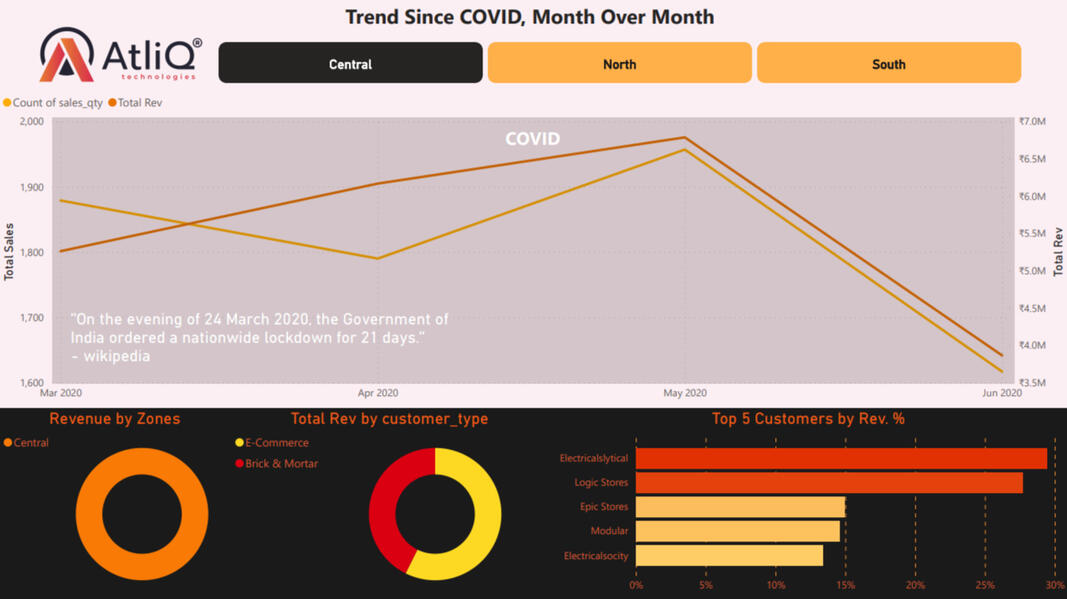
March of 2020 is when India had a nationwide shutdown due to COVID19. As you can see in the dashboard, since the lock down, revenue dropped from ₹26.3 million down to ₹14.7 million rupees, a 44% loss in revenue. And the largest customer, Electricalsara Stores, when from ₹13.2 million rupees down to ₹5.3 million rupees, 60% loss in revenue due to the lockdown. This could be because it is a brick and mortar type of business.
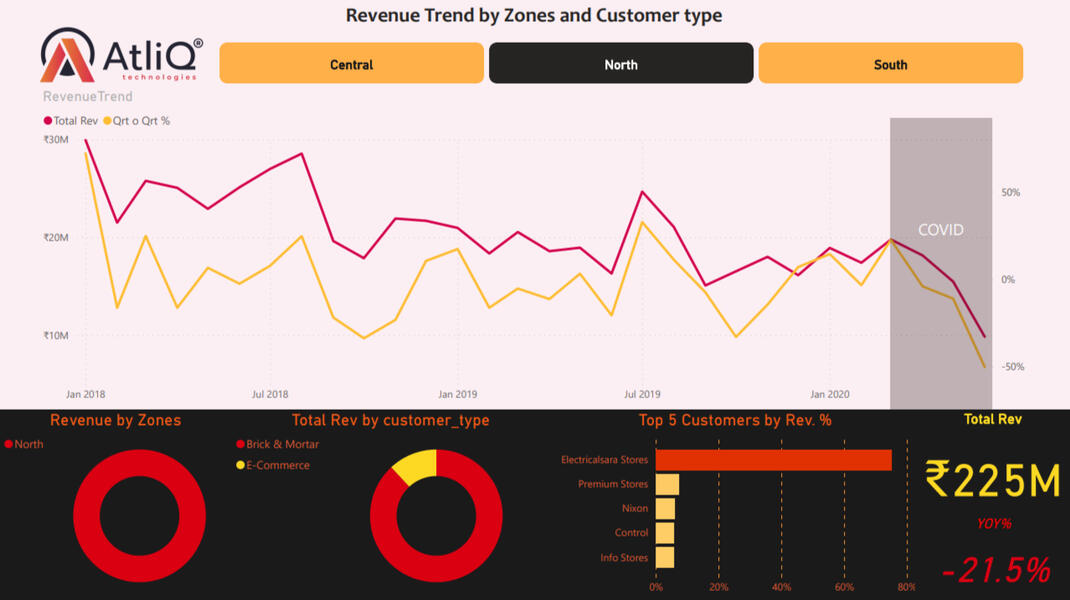
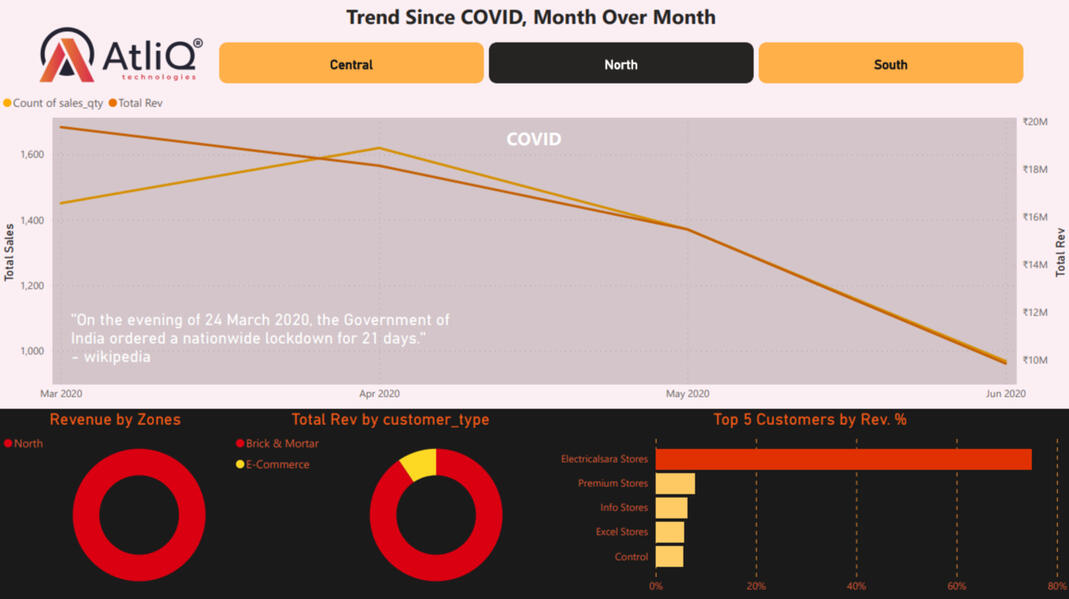
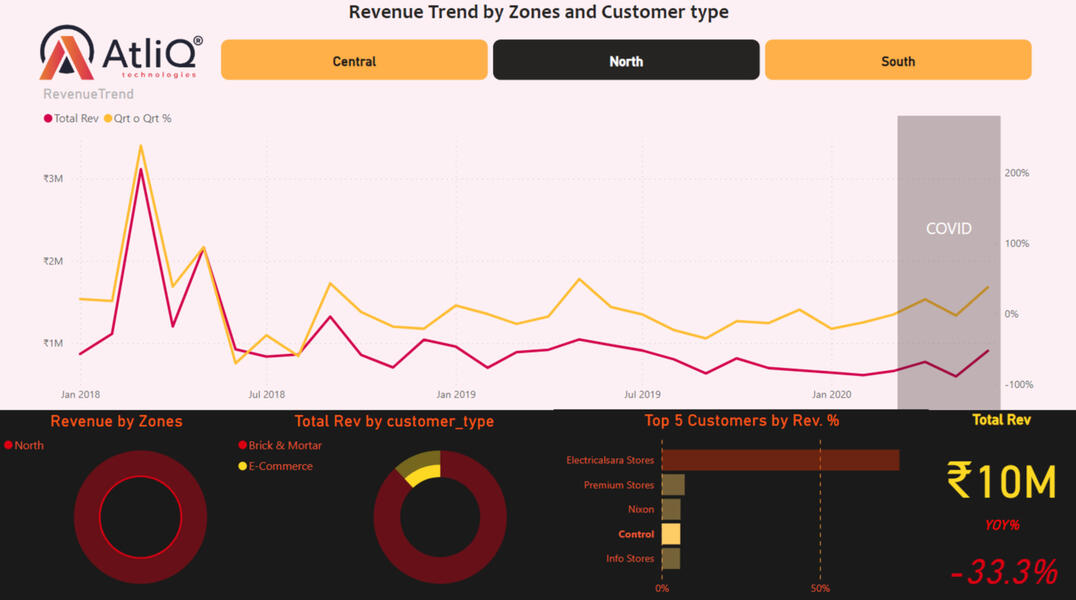
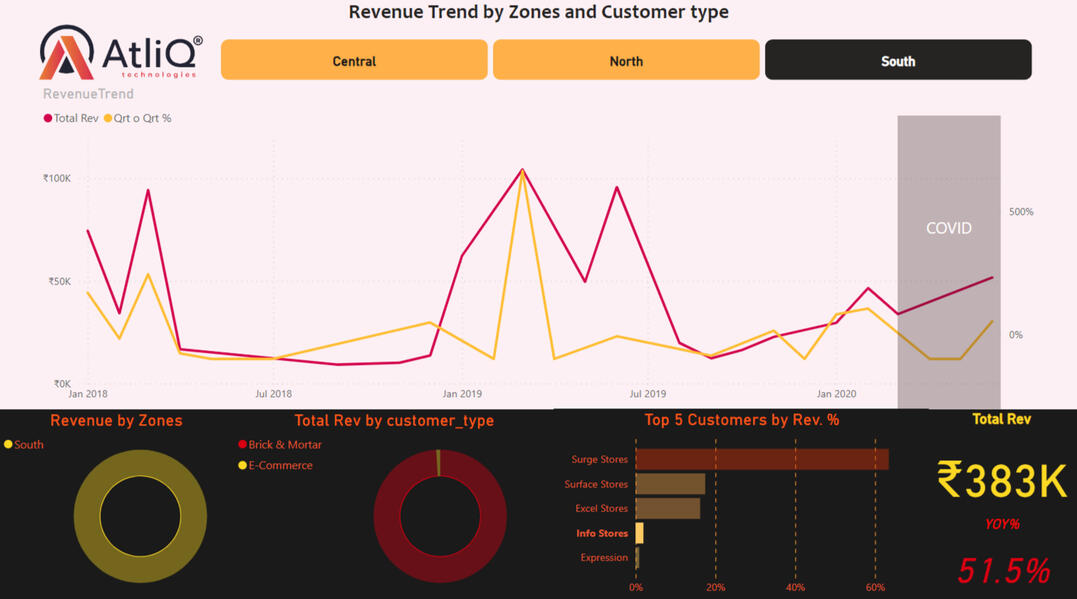
From all the Atliq customers, two stores stands out. Control from the north region and Info Store from the south region. These were the two stores that continued to grow in revenue while all the other stores were going down. These two stores also shows that it was an e-commerce store. Looking into these two customers deeper could bring insight into why this is was the case, and apply what worked there to the other stores.
Next, if profit data were shared, there could be more insight on how much of the revenue was profits to further look into store performance.
# Sales Insight using MySQL and PowerBISales are going down and we want to know why? Is it regional?
Has there been a new business to disrupt ours?## MySQL
After loading the SQL files, I familiarized myslef with the 5 tables by looking at the columns of each table.sql
SELECT * FROM sales.customers;
SELECT * FROM sales.dates;
SELECT * FROM sales.markets;
SELECT * FROM sales.producsts;
SELECT * FROM sales.transactions;
Customers table
check if customertype field is consistent
sql
 SELECT distinct(customer_type) FROM sales.customers
Check to see the range of years I am working with in dates table by sorting the year column.
2017 -2020Markets table-
There were 2 rows where zones were blank. These were one off sales in the USA, that is not used for this analysis, as the main market is in India, as noted by stakeholder.
sql
 SELECT distinct(zone) FROM sales.markets
 SELECT * FROM sales.markets
 where zone = '';
Blank zones field:
Mark097 New York
Mark999 ParisDeleted the two rows*
sqlTransactions table
DELETE FROM markets where markets_code = 'Mark097';
DELETE FROM markets where markets_code = 'Mark999';
Currency row duplicates,
'INR'
'USD'
'INR\r'
'USD\r'
sql
 SELECT count(*) FROM sales.transactions
 where currency = 'USD';
 SELECT count(*) FROM sales.transactions
 where currency = 'USD\r';
 SELECT count(*) FROM sales.transactions
 where currency = 'INR';
 SELECT count(*) FROM sales.transactions
 where currency = 'INR\r';
2 rows USD
2 rows USD\r
both were indetical rows. omit 'USD', use 'USD\r'INR and INR\r
279 vs 150000There is a discrepency in row count for INR. However, it seems that 279 rows are duplicates.
took a sample row to check if there is duplicate
sql
 SELECT * FROM sales.transactions
 where order_date = '2017-10-10' and sales_amount = '41241';
 SELECT * FROM sales.transactions
 where order_date = '2019-09-27' and sales_amount = '105301';
and got two identical rows with those fields, but different currency.Confirmed with stakeholder about duplicates and use only the currency rows from 'INR\r' and \USD\r'
sqlSELECT count(*) FROM sales.transactions
DELETE FROM transactions where currency = 'INR';
DELETE FROM transactions where currency = 'USD';
where currency = 'INR';
SELECT count(*) FROM sales.transactions
where currency = 'USD';
confirmed '0' rows after deleting the above rows.Checking for salesamount equal or less than '0'.sql
SELECT count(*) FROM sales.transactions
where sales_amount <= 0;
'1607'Can we have '0' or negative sales amount?
Stakeholder says no.
Delete and confirm.
sql## Power BI
DELETE FROM transactions where sales_amount <= 0;
SELECT * FROM sales.transactions
where sales_amount <= 0;
### Data Modeling and ETL
Upload the tables into Power BI.Data Modeling - Create Star Schema
I matched up the primary keys to create a star schema around transaction table.Transform data
Home> Transform Data> Power Query EditorRemoved zones that were blank in the markets table, as business is only done in India.
In sales.markets, filter out the blank rows in zone.
= Table.SelectRows(sales_markets, each ([zone] <> ""))
Assumed, because 0 is no transaction. But normally, I will need to verify with stakeholder that the data is a duplicate, and if so which data duplicate to use.
= Table.SelectRows(sales_transactions, each ([sales_amount] <> -1 and [sales_amount] <> 0))
Removed duplicate currencies in transactions table.
Assumed. but normally, I will need to verify with stakeholder that the data is a duplicate, and if so which data duplicate to use.
= Table.SelectRows(#"remove-1/0 sales amount", each ([currency] = "INR#(cr)" or [currency] = "USD#(cr)"))
Normalized the currenices into INR.
I added a new custome column to convert the USD into INR to normalize the data.
I used historical monthly average for the USD to INR conversion at 64.84, for the two transactions in USD currency that were done in 11/20/2017 and 11/22/2017
= Table.AddColumn(#"cleanup currency", "Norm_sales_amount", each if [currency] = "USD#(cr)" then [sales_amount]*64.84 else [sales_amount])
### Power BI - DashboardAfter cleaning up the data, I created some base measurements. Total Revenue, Total sales qty, YOY%, QOQ%, MOM%Total Revenue
Total Premium = SUM('sales transactions'[Norm_sales_amount])
Total Sales
Sales Qty = sum('sales transactions'[sales_qty])
 YOY Premium Growth % =
 VAR PYPremium =
 CALCULATE([Total Premium],DATEADD('sales date'[date],-1,YEAR))
 RETURN
 DIVIDE(([Total Premium]-PYPremium),PYPremium)
Atliq Technologies is a computer hardware and peripheral company in India. They are based in the Northen region of India, with stores throughout India. This was a personal project using real data from a real company that shared its data to learn from.
There is an overall trend down in revenue since 2018, with a total Revenue of ₹336 Million (Indian Rupees) to date. The North region makes up over 68% of the total revenue, and 75% of that is from Electricalsara Stores.
March of 2020 is when India had a nationwide shutdown due to COVID19. As you can see in the dashboard, since the lock down, revenue dropped from ₹26.3 million down to ₹14.7 million rupees, a 44% loss in revenue. And the largest customer, Electricalsara Stores, when from ₹13.2 million rupees down to ₹5.3 million rupees, 60% loss in revenue due to the lockdown. This could be because it is a brick and mortar type of business.
From all the Atliq customers, two stores stands out. Control from the north region and Info Store from the south region. These were the two stores that continued to grow in revenue while all the other stores were going down. These two stores also shows that it was an e-commerce store. Looking into these two customers deeper could bring insight into why this is was the case, and apply what worked there to the other stores.
Next, if profit data were shared, there could be more insight on how much of the revenue was profits to further look into store performance.